Comparing Grid Energy Usage In A House With & Without Solar
The below blog post shows how you can save serious dollars by installing a 5kW solar system in Sydney, it outlines how we look at power used and how the network buys back power from houses resulting in a two-pronged way to save
- Money saved by using solar energy
- Money earned by selling excess solar energy back to the grid
These two income avenues are available to anyone who gets solar right from day one of your system being installed

Typical High Energy usage in Australian Houses
An example of a typical high energy usage Australian house is shown below as having a demand profile that peaks in the morning around 8 am-9 am and beaks again in the evening around 6 pm-8 pm.
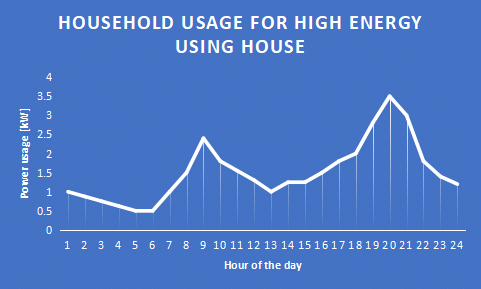
The topline: represents instantaneous power usage
Area of each bar under the line: represents 1-hour energy usage
The sum of all bars: represents the total energy used per day in this case it is just over 36kWh per single day.
In the case above the graph shows a household’s energy usage for a house without solar, if we assume that the price of electricity from the grid is 28c/kWh then the 36.3kWh will cost $10.16 per day.
Now, what if we look at the solar power generated and the energy this adds up to over a single day from a 5kW installation in Sydney? We can see that the power peaks at 5kW around 12 mid-day.
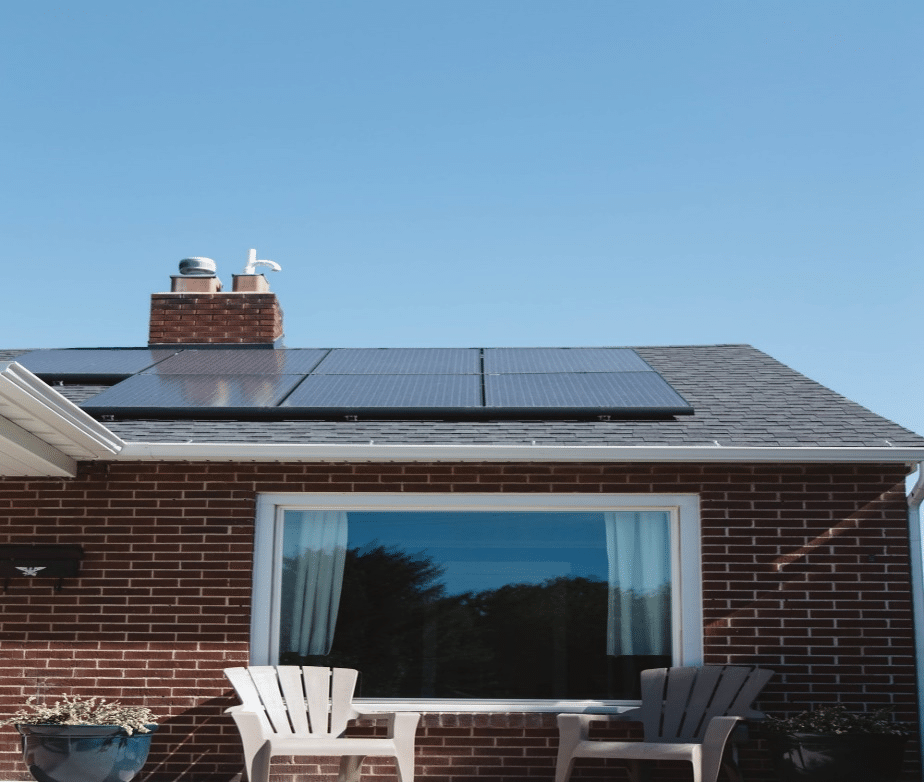
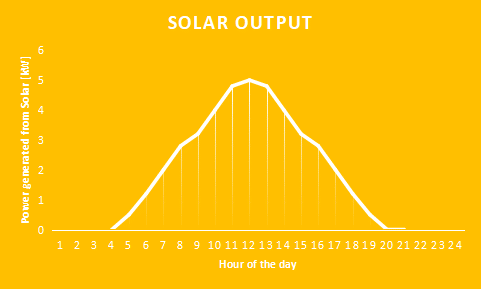
The topline: represents instantaneous power delivery from the 5kW solar installation
Area of each bar under the line: represents energy generation over 1 hour from solar
The sum of all bars: represents the total energy generated per day from the 5kW solar installation, in this case, it is 42kWh per single day.
Now if we combine the graphs we see three regions:
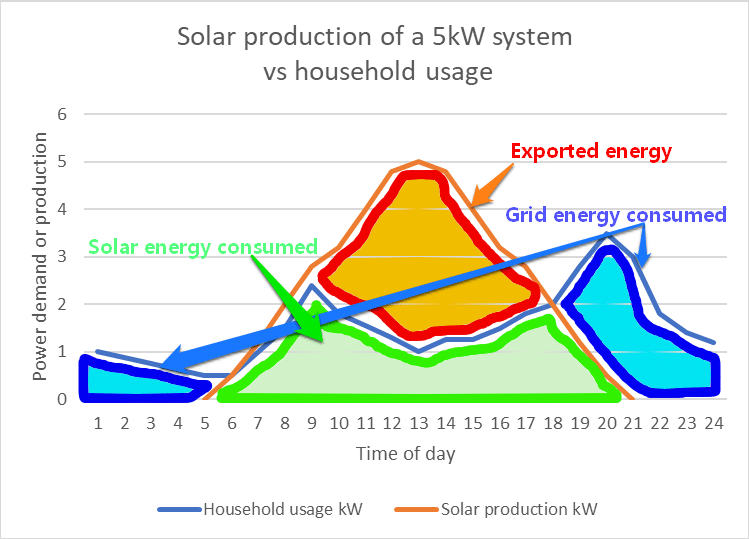
- Amount of grid power used when there is no solar, at night time or early morning for example
- Amount of solar energy used when there is solar power being generated
- Amount of solar exported back to the grid when there is excess solar available
What we thus see is two cases case A and case B:
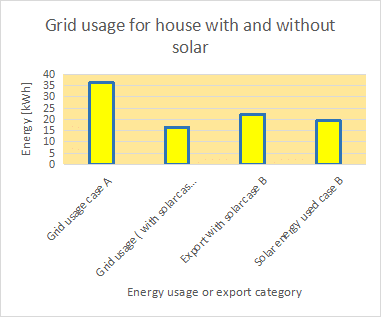
Now in comparison of a house with and without solar, if we assume electricity from the grid costs $0.28/kWh and that the export will earn a feed-in tariff from the network of $0.12/kWh, we can see below that having solar can save you big dollars every day:
Under case A there is:
- No solar and only grid usage of 36kWh per day costing $10.16 per day
Under case B there is:
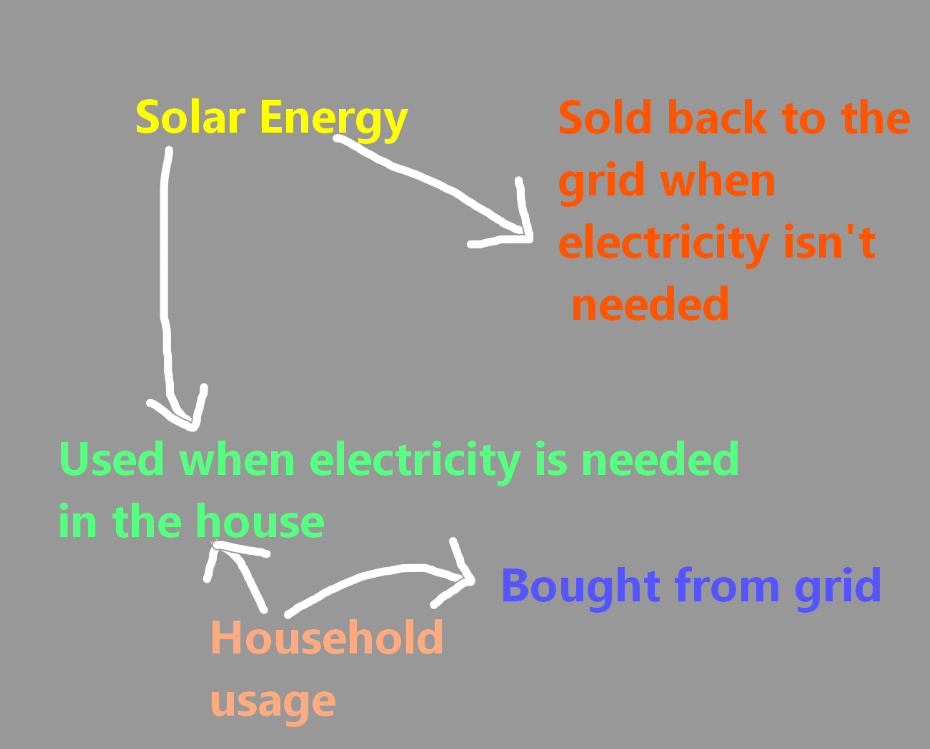
Both grid power and solar power being used resulting in only 16.55 kWh being used from the grid and the rest being sourced from the solar, on top of this the excess solar generated during the middle of the day can be sold to the grid to generate an income via the 12c feed-in tariff from the electricity retailer. The table below sums up the energy flows.
What this means is that the total cost of electricity for a house with solar is as follows:
-
- Cost of energy total = cost of grid usage – income from the export
- E.g Cost of energy ( with solar ) =$4.63- $2.67 =$1.96
- Cost of energy total = cost of grid usage – income from the export
So to sum up: A typical house without solar can save $ 8.20 per day without a battery and without having any change in times of appliance usage:
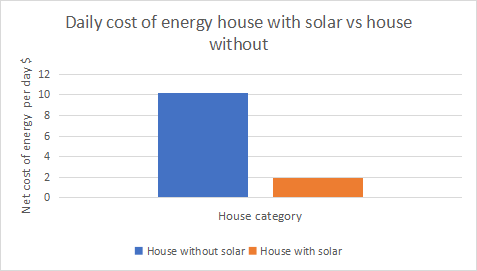
If a household tries to use more of their energy during the middle hours of the day, say between 10 am and 2 pm, then the savings will be even higher. Also when a battery is used in conjunction with solar these savings are again increased, this will be looked at in further blog posts.
Thanks for reading!
Written by Anders Jensen


 1300-713-998